在学习 ThreadLocal 的时候有人推荐了 JProfiler ,可以用来对 Java 内存泄露分析,JProfile 其实是一个 Java 的性能分析工具,不仅可以用来排查 OutOfMemoryError 的错误,对于查找系统瓶颈,查看 Java 堆信息等等都有很强大的功能支持。
搜索一番之后发现也有很多 Java Profiler 的工具,JDK 自带也有 Java VisualVM 这样的工具。
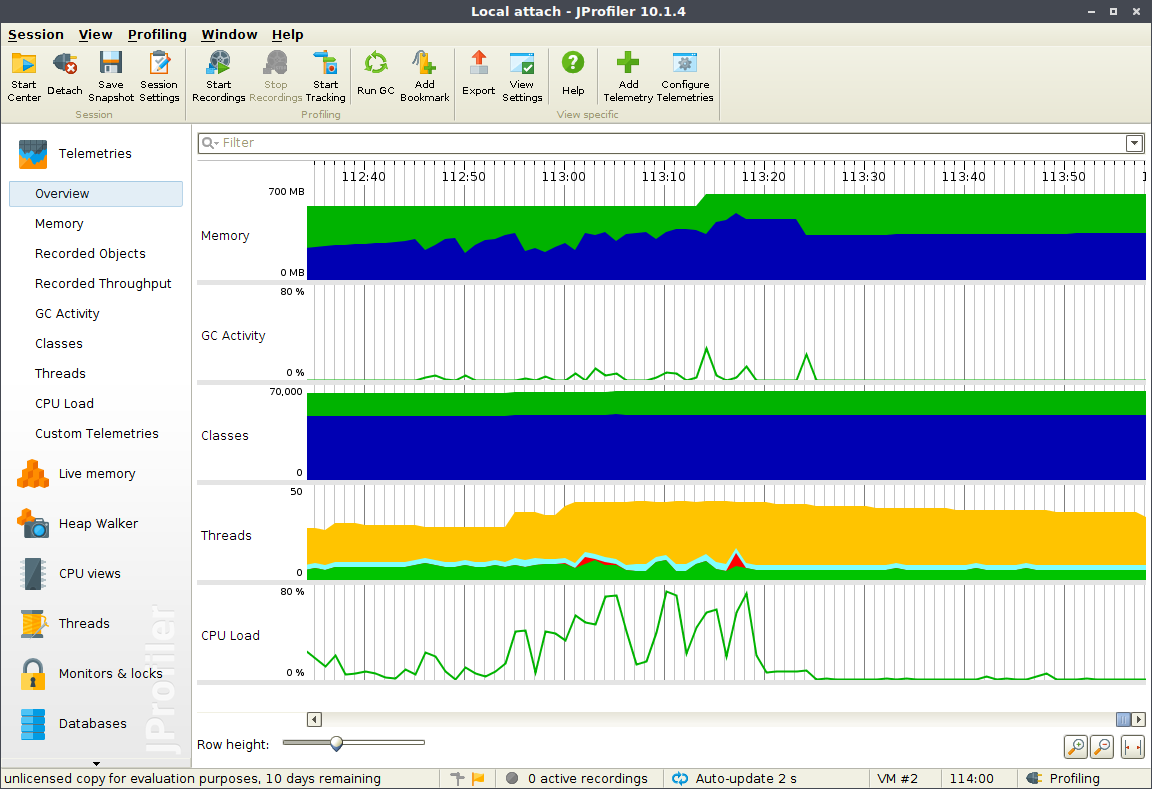
JProfiler
JProfiler’s intuitive UI helps you resolve performance bottlenecks, pin down memory leaks and understand threading issues.
安装注册
官网地址:
JProfiler 是商业软件,有 10 天试用期,到期注册码自行解决。
特性
- profile a demo session and a saved session
- attach a running jvm
- profile an application server, locally or remotely
- open a snapshot, can open HPROF and PHD snapshots
数据采集方式
两种采集方式
- Sampling 采样,间隔时间将每个线程栈中方法栈中的信息统计出来,对应用影响小,数据统计可能不精确
- Instrumentation, 在 class 加载之前,JProfier 把相关功能代码写入到需要分析的 class 中,对正在运行的 jvm 有一定影响。
启动方式
- Attach mode ,将本机正在运行的 jvm 加载 JProfiler Agent
- Profile at startup,将指定的 JProfiler Agent 手动加载到该 jvm
- Prepare for profiling
- Offline profiling