分析 Java 内存
What Is Heap
The space used by the Java Runtime to allocate memory to Objects and JRE Classes is called Heap. The heap space can be configured using the following JVM arguments:
-Xmx<size> — Setting maximum Java heap size
-Xms<size> — Setting initial Java heap size
Heap dump is a snapshot of the Java memory. It contains information about the Java objects and classes in the heap at the moment the snapshot is triggered.
take heap dump without hanging the application
First, you have to identify the Java process Id:
ps aux |grep "java"
the normal way to capture the heap dump is using jmap:
jmap -dump:live,format=b,file=/tmp/heapdump.hprof PID
Try the following. It comes with JDK >= 7:
/usr/lib/jvm/jdk-YOUR-VERSION/bin/jcmd PID GC.heap_dump FILE-PATH-TO-SAVE
Example:
/usr/lib/jvm/jdk1.8.0_91/bin/jcmd 25092 GC.heap_dump /opt/hd/3-19.11-jcmd.hprof
This dumping process is much faster than dumping with jmap! Dumpfiles are much smaller, but it’s enough to give your the idea, where the leaks are.
Analyse heap file
Memory Analyzer Tool (MAT)
The [[Eclipse Memory Analyzer]] is a fast and feature-rich Java heap analyzer that helps you find memory leaks and reduce memory consumption.
Use the Memory Analyzer to analyze productive heap dumps with hundreds of millions of objects, quickly calculate the retained sizes of objects, see who is preventing the Garbage Collector from collecting objects, run a report to automatically extract leak suspects.
Eclipse Memory Analyzer Tool 是一个基于 Eclipse 的分析工具。
Shallow Heap 和 Retained Heap 区别
Out of memory 问题
I recently installed Eclipse MAT (Eclipse Memory Analyzer Version 1.9.1) on Mac OS Catalina (10.15.3). I needed to review a 4g heap dump. The default JVM heap size for MAT is 1024m.
I think the easiest way to increase the JVM’s heap size is to use a shell window - go to the /Applications/mat.app/Contents/Eclipse/ folder. Then vi MemoryAnalyzer.ini and change -Xmx1024m to your required value, in my case I went with -Xmx10g.
To review the change, restart MAT and go to the help -> About Eclipse Memory Analyzer then click installation details, and look for the entry: eclipse.vmargs=-Xmx10g about 50 lines down.
reference
在 Trello 中使用 Pomodoro 工作法
我的 Trello 中有这样一张卡片 —- 学习在 Trello 中使用 Pomodoro —- 已经很久了,这期间也看了一些《番茄工作法》的书,重要的是我开始重度依赖于 Trello 来作为我的任务管理以及时间管理工具。这期间也尝试用 Plus for Trello 来提高使用 Trello 的效率。当然也得到一些体验,但到现在我依然觉得有哪个地方不太对,我很多时候没有严格按照 Pomodoro 约定的 25-5 分钟来执行一些任务,而正是这些任务,可能耗费太长时间所以在我的 Trello 看板中想生根了一样,很久很久没有移动。虽然每天都想要移动一下,但终究没有结果。所以我想写这篇文章来回顾一下我的使用方式,以及想在回顾的过程中发现存在的问题。
25-5 时间划分
就像 Pomodoro 约定的那样 25 分钟 Focus,5 分钟休息,我在刚刚开始的时候也非常的不适应,我可能把之前的习惯带了过来,并没有制定计划,也不知道一项任务可能花费的时间,就这样糊涂的开始,然后糊涂的结束。所以我开始思考为什么 Pomodoro 工作法需要将时间划分到 25 分钟,经过几个月的思考,我想是因为,必须要保证我的每一个任务都是可以追踪的,可以预估时间的,而只有细分的任务才有被衡量的价值,这样才能够尽快的达到既定目标。而不是因为目标太遥远,日久之后就渐渐忘掉,也不是因为太过于复杂,需要拆分多个任务而迟迟无法展开。
我的常用看板里面里经常有这样一条,看某某书,学习某个新技能,而这两个例子正是无法追踪和衡量的,看某本书,实际可能是一个比较长的过程,尤其是技术类书籍,利用 Trello 的卡片显然是覆盖不了的,同理和学习一个新技能一样,学到什么程度算是学习,是需要入门这个技术,还是需要到熟悉的程度,还是说要精通,这个卡片显然是不能够决定的。所以我想是不是以后我再添加这些卡片的时候,可以比如提前看一下书籍的目录,根据目录将书划分成多个模块,然后利用一列来管理这些章节的内容,同理学习某一个新技术能不能将入门,比如在我的机器上将其 Demo 跑通,然后阅读某块源码单独作为独立的开片来进行管理。
基于这个思路,以及官方 How to Pomodoro Your Way to Long-Lasting Productivity 中所说,我逐渐将我的任务卡片细化,原来我可能只会在开片上写一个关键字来提醒我,而现在我则有意识的将其写成动名词结构,比如“写一篇关于如何在 Trello 中实践 Pomodoro 的文章”,然后我会使用 Plus for Trello 来预估一个完成这个任务的时间。Plus for Trello 会将预估的时间写入到卡片的评论中,这样所有的 Web 界面都可以实时同步。
plus! 0/2
这表示我预估需花费 2 个小时的时间来完成这个任务(这里的语法是 Spent/Estimate)。而每次开始任务都使用 Plus for Trello 的计时器功能,结束时会自动提交一个评论,比如
plus! 0.62/0
则表示这次花费了 0.62 小时。
使用 Prometheus 和 Grafana 监控 Proxmox 服务器
虽然 Proxmox 自身已经有一个比较简单的系统监控,但对于我来说每一次都需要登录到其后台才能看到,而且它自身的监控视图是没有报警策略的。所以我想着这两天反正在学习 Prometheus 这不是正好是一个不错的契机来在具体环境中使用一下,所以才有了这篇文章。Prometheus 和 Proxmox 相关的内容可以参考之前的文章。
首先来对比一下前后的效果。
Proxmox 后台默认的监控面板。
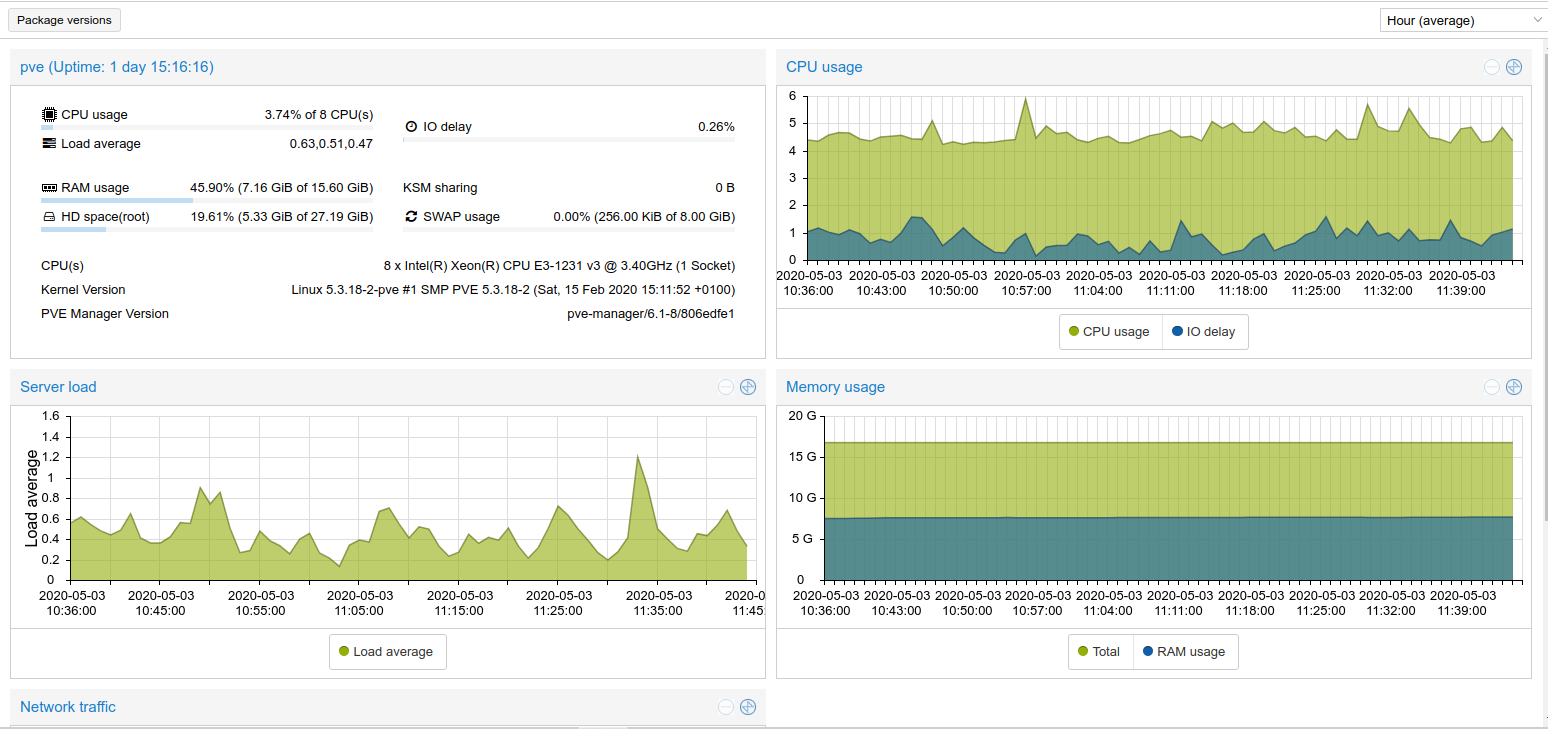
Grafana 中显示

当然如果你不喜欢这个样式,Grafana 给予了用户非常充分的定制化可能,你可以自己打造自己的监控视图。
安装 Prometheus
准备工作
准备工作:
sudo groupadd --system prometheus
sudo useradd -s /sbin/nologin --system -g prometheus prometheus
创建配置目录:
sudo mkdir /var/lib/prometheus
for i in rules rules.d files_sd; do sudo mkdir -p /etc/prometheus/${i}; done
下载 Prometheus 二进制:
mkdir -p /tmp/prometheus && cd /tmp/prometheus
curl -s https://api.github.com/repos/prometheus/prometheus/releases/latest \
  | grep browser_download_url \
  | grep linux-amd64 \
  | cut -d '"' -f 4 \
  | wget -qi -
配置
解压和配置
tar xvf prometheus*.tar.gz
cd prometheus*/
mv prometheus promtool /usr/local/bin/
mv prometheus.yml  /etc/prometheus/prometheus.yml
mv consoles/ console_libraries/ /etc/prometheus/
清理
cd ~/
rm -rf /tmp/prometheus
创建 systemd 配置
这里使用 systemd 来配置管理 Prometheus
sudo tee /etc/systemd/system/prometheus.service<<EOF

[Unit]
Description=Prometheus
Documentation=https://prometheus.io/docs/introduction/overview/
Wants=network-online.target
After=network-online.target

[Service]
Type=simple
User=prometheus
Group=prometheus
ExecReload=/bin/kill -HUP $MAINPID
ExecStart=/usr/local/bin/prometheus \
  --config.file=/etc/prometheus/prometheus.yml \
  --storage.tsdb.path=/var/lib/prometheus \
  --web.console.templates=/etc/prometheus/consoles \
  --web.console.libraries=/etc/prometheus/console_libraries \
  --web.listen-address=0.0.0.0:9090 \
  --web.external-url=

SyslogIdentifier=prometheus
Restart=always

[Install]
WantedBy=multi-user.target
EOF
配置相应的权限
for i in rules rules.d files_sd; do sudo chown -R prometheus:prometheus /etc/prometheus/${i}; done
for i in rules rules.d files_sd; do sudo chmod -R 775 /etc/prometheus/${i}; done
sudo chown -R prometheus:prometheus /var/lib/prometheus/
启动及配置开机启动
sudo systemctl daemon-reload
sudo systemctl start prometheus
sudo systemctl enable prometheus
检查
这个时候可以检查一下 9090 端口(直接访问浏览器,或者 netstat -tupln | grep 9090)
Install proxmox-pve-exporter
看过之前关于 Prometheus 那片文章应该就知道 Prometheus 有两种获取数据的方法,pull 和 push,这里我们在 Proxmox 上安装 exporter,然后让 Prometheus 来 pull 数据。
准备
安装必要的组件
apt install python python-pip
pip install prometheus-pve-exporter
创建授权配置:
vi /etc/prometheus/pve.yml
写入:
default:
	user: user@pve
	password: your_password_here
	verify_ssl: false
在这里要注意一个坑,使用 prometheus-pve-exporter 依赖于 Proxmox 的用户授权,而这里的用户需要到 Proxmox 后台,DataCenter -> user 标签下查看,对于我而言,这里需要填写 root@pam.
systemd
sudo tee /etc/systemd/system/prometheus-pve-exporter.service<<EOF
[Unit]
Description=Prometheus exporter for Proxmox VE
Documentation=https://github.com/znerol/prometheus-pve-exporter

[Service]
Restart=always
User=prometheus
ExecStart=/usr/local/bin/pve_exporter /etc/prometheus/pve.yml

[Install]
WantedBy=multi-user.target
EOF
reload systemd
systemctl daemon-reload
systemctl start prometheus-pve-exporter
systemctl enable prometheus-pve-exporter
将 proxmox-pve-exporter 添加到 Prometheus
vi /etc/prometheus/prometheus.yml
增加配置:
- job_name: 'proxmox'
  metrics_path: /pve
  static_configs:
  - targets: ['localhost:9221']
重启服务:
systemctl restart prometheus
重启后可以到 Prometheus 界面 Target 查看节点是否 Up.
我在配置的过程中遇到一个问题,就是配置授权的时候用户名写的不对,报错
returned HTTP status 500 INTERNAL SERVER ERROR
使用 journalctl -xe 可以看到错误日志:
May 03 12:32:25 pve pvedaemon[291021]: authentication failure; rhost=127.0.0.1 user=xx@pve msg=no such user ('xx@pve')
这个时候一定要检查用户名。另外也不建议直接使用 root 用户, 可以使用 useradd monitor 新建一个用户来进行管理。
- 登录终端
useradd monitor添加 1 - Web 后台 Permissions -> User 给用户
monitor@pam设置密码 - Web 界面,datacenter -> Roles -> Create,新建一个名叫
Monitoring的角色,赋予Datastore.Audit,Sys.Audit,Sys.Modify,VM.Audit,VM.Monitor的权限 - 然后 Permissions 中新建 User Permission,依次选
/,monitor@pam,Monitoring然后新建。
此时配置授权的时候就可以使用 monitor@pam 加上设定的密码了。再检查一下 journalctl -xe 日志,/pve 接口返回 200 ,正常了。
pve_exporter 所能提供的打点 Metrics 大致有如下一些:
pve_cluster_info
pve_cpu_usage_limit
pve_cpu_usage_ratio
pve_disk_read_bytes
pve_disk_size_bytes
pve_disk_usage_bytes
pve_disk_write_bytes
pve_guest_info
pve_memory_size_bytes
pve_memory_usage_bytes
pve_network_receive_bytes
pve_network_transmit_bytes
pve_node_info
pve_storage_info
pve_up
pve_uptime_seconds
pve_version_info
Node exporter
安装 node_exporter 的方法之前的文章中已经有写。安装后配置 Prometheus target
  - job_name: 'node_exporter'
	scrape_interval: 10s
	scrape_timeout: 10s
	static_configs:
	  - targets: ['10.0.0.5:9100']
Install Grafana
直接参考 官网
添加 source
sudo tee /etc/apt/sources.list.d/grafana.list<<EOF
deb https://packages.grafana.com/oss/deb stable main
EOF
获取 key
curl https://packages.grafana.com/gpg.key | sudo apt-key add -
安装:
sudo apt update && sudo apt install -y apt-transport-https grafana
sudo systemctl enable --now grafana-server
systemctl status grafana-server.service
访问 localhost:3000 ,用户名密码都是 admin。
配置监控
进入 Grafana 后,需要添加数据源,然后添加自己的 Dashboard 和 Panel,如果不熟悉操作过程,可以先导入别人的模板,学习一下别人是怎么做的。
侧边栏,Create -> Import,输入神秘代码:1860,可以导入 别人创建好的模板。
在熟悉了整个工作流程之后,就可以自己依照自己的需求来修改自己的 Dashboard.
几个比较不错的 Dashboard 模板
总结
至此所有的配置过程就全部结束了,但这可能只是我学习 Prometheus 以及 Proxmox 的第一步,因为目前这台服务器上的服务并不多,虚拟机也只是因为学着玩而安装的 OpenMediaVault 以及 Ubuntu Server,而 Prometheus 中数据库的 Exporter,Nginx 的 Exporter,可以使用类似的方式慢慢加入进来,这个时候参考官网以及相关的 GitHub 也就能实现了。
在这个过程中也慢慢的体会到 less is more 的哲学,很早就听说过这句话,但尤其在这里更加深刻的理解了,这篇文章中提到的每一个服务都专注于自己的最核心的功能,Prometheus Server 专注于采集数据,Exporter 负责暴露数据,而 Grafana 则负责可视化,tsdb 负责记录数据,Proxmox 则是站在巨人的肩膀上专注于虚拟化。这些服务各自都在自己的领域做到极致,那么最好只需要完整的把他们组合到一起,就可以实现 1+1>2 的效果。
reference
Proxmox Web 界面停止工作解决
今天想把 Proxmox 的静态地址改一下的,但是重启后发现 Web UI 竟然不工作了。SSH 登录后台 netstat -tupln 看 8006 端口也没有起来。这一下子突然不知所措,只能一点点 Google,不过幸好问题不算太大。
在 官方论坛 里翻到一个帖子,照着他的方法:
service pve-cluster restart
运行命令后服务报错了,这就比较好办了,有报错总比抓瞎好,查看服务日志:
journalctl -xe
然后明显的看到红字:
May 01 20:01:22 pve systemd[1]: pve-cluster.service: Start request repeated too quickly.
May 01 20:01:22 pve systemd[1]: pve-cluster.service: Failed with result 'exit-code'.
-- Subject: Unit failed
-- Defined-By: systemd
-- Support: https://www.debian.org/support
--
-- The unit pve-cluster.service has entered the 'failed' state with result 'exit-code'.
May 01 20:01:22 pve systemd[1]: Failed to start The Proxmox VE cluster filesystem.
-- Subject: A start job for unit pve-cluster.service has failed
-- Defined-By: systemd
-- Support: https://www.debian.org/support
继续看帖子,发现是不是有可能是因为 hostname 没有找到对应的 ip。毕竟在我时隔一个月重启后我发现 hostname 被修改成了 ubuntu2,而我之前明明是 pve 来着。于是顺藤摸瓜看看
vi /etc/hostnames
vi /etc/hosts
果然发现 hostnames 被改了,于是改回 pve,然后查看 /etc/hosts 里面的内容的时候,顶部几个注释引起了我的关注
# Your system has configured 'manage_etc_hosts' as True.
# As a result, if you wish for changes to this file to persist
# then you will need to either
# a.) make changes to the master file in /etc/cloud/templates/hosts.debian.tmpl
# b.) change or remove the value of 'manage_etc_hosts' in
#     /etc/cloud/cloud.cfg or cloud-config from user-data
我突然想起来之前安装过 cloud-init ,然后照着注释的内容在对应的文件里面把 hostname 和 IP 填了进去。然后重启问题就解决了。
各个职业的誓言
最近因为《太阳的后裔》中姜暮烟的医生宣誓再一次把医生的誓言放到了观众面前,而之前在《浪漫医生金师傅》、《라이프》中都或多或少的提到医术的誓言。我脑海突然一下子浮现了韩剧中各色职业的誓言,编剧都把他们融合到了台词,或者主人公的性格中。《Live》中的警察誓言,《秘密森林》、《检察官内传》中检察官的誓言,到《辅佐官》中议员的誓言。韩剧用一种理想化的方式来表现这些公职角色的形象,而最近《You quiz on the block》中的法医,警察,犯罪心理侧写师则是实实在在的于现实中履行自己的义务。
如果这些公职人员都能做到自己力所能及之事,而普通人始终恪守自己的底线,这个社会又会变得怎么样?
医生
我们来看看真实的希波克拉底誓言,韩国医学院毕业生宣誓的内容。有些时候看着这些无私的誓言会觉得这个世界还是存在一些光明的,尤其是在如今肺炎蔓延到全球的时候。
韩国
이제 의업에 종사할 허락을 받음에, 나의 생애를 인류봉사에 바칠 것을 엄숙히 서약하노라. 나의 은사에 대하여 존경과 감사를 드리겠노라. 나의 양심과 위엄으로서 의술을 베풀겠노라. 나의 환자가 알려준 모든 비밀을 엄중히 지키겠노라. 나는 의업의 고귀한 전통과 명예를 유지하겠노라 나는 동업자를 형제처럼 여기겠노라. 나는 인류, 종교, 국적, 정당, 정파, 또는 사회적 지위 여하를 초월하여 오직 환자에 대한 나의 의무를 지키겠노라. 나는 인간의 생명을 그 수태된 때로부터 지상의 것으로 존중히 여기겠노라. 비록 위협을 당할지라도 나의 지식을 인도에 어긋나게 쓰지 않겠노라
这里是比较简陋的翻译(非逐字翻译):
现在我已获准从事医疗事业,我庄严宣誓,将我的毕生献给全人类,把病人的健康和生命放在首位,无论种族,宗教,国籍,政党派别和社会地位,只对病人履行我的义务。即使受到威胁,也绝不利用我的知识做违背人道的事情。
希波克拉底誓言
Hippocrates:The Oath of Medicine
You do solemnly swear, each by whatever he or she holds most sacred
That you will be loyal to the Profession of Medicine and just and generous to its members
That you will lead your lives and practice your art in uprightness and honor
That into whatsoever house you shall enter, it shall be for the good of the sick to the utmost of your power, your holding yourselves far aloof from wrong, from corruption, from the tempting of others to vice
That you will exercise your art solely for the cure of your patients, and will give no drug, perform no operation, for a criminal purpose, even if solicited, far less suggest it
That whatsoever you shall see or hear of the lives of men or women which is not fitting to be spoken, you will keep inviolably secret
These things do you swear. Let each bow the head in sign of acquiescence
And now, if you will be true to this, your oath, may prosperity and good repute be ever yours; the opposite, if you shall prove yourselves forsworn.
1948 日内瓦宣言
At the time of being admitted as a member of the medical profession
I solemnly pledge myself to consecrate my life to the service of humanity:
I will give to my teachers the respect and gratitude which is their due;
I will practice my profession with conscience and dignity;
The health and life of my patient will be my first consideration;
I will respect the secrets which are confided in me;
I will maintain by all means in my power, the honor and the noble traditions of the medical profession;
My colleagues will be my brothers:
I will not permit considerations of religion, nationality, race, party politics or social standing to intervene between my duty and my patient;
I will maintain the utmost respect for human life, from the time of its conception,
even under threat, I will not use my medical knowledge contrary to the laws of humanity;
I make these promises solemnly, freely and upon my honor…
值此进入医生职业之际,我庄严宣誓为服务于人类而献身。
我对施我以教的师友衷心感佩。
我在行医中一定要保持端庄和良心。
我一定把病人的健康和生命放在一切的首位,病人吐露的一切秘密,我一定严加信守,决不泄露。
我一定要保持医生职业的荣誉和高尚的传统。
我待同事亲如弟兄。
我决不让我对病人的义务受到种族、宗教、国籍、政党和政治或社会地位等方面的考虑的干扰。
对于人的生命,自其孕育之始,就保持最高度的尊重。
即使在威胁之下,我也决不用我的知识作逆于人道法规的事情。
我出自内心以荣誉保证履行以上诺言。
美国
I solemnly pledge to concentrate my life to the service of humanity. I will give my teachers the respect and gratitude that is their due. I will practice my profession with conscience and dignity. The health of my patients will be my number one consideration. I will respect the secrets that are confided in me, even after my patient has died. I will maintain by all the means in my power, the honor and the noble traditions of the medical profession. My colleagues will be my sisters and brothers. I will not permit considerations of age, disease or disability, creed, ethnic origin, gender, race, political affiliation, nationality, sexual orientation, social standing, or any other factor to intervene between my duty and my patient. I will maintain the utmost respect for human life. I will not use my medical knowledge to violate human rights and civil liberties, even under threat. I make these promises solemnly, freely, and upon my honor.
中国
健康所系,性命相托。 当我步入神圣医学学府的时刻,谨庄严宣誓: 我志愿献身医学,热爱祖国,忠于人民,恪守医德,尊师守纪,刻苦钻研,孜孜不倦,精益求精,全面发展。 我决心竭尽全力除人类之病痛,助健康之完美,维护医术的圣洁和荣誉,救死扶伤,不辞艰辛,执着追求,为祖国医药卫生事业的发展和人类身心健康奋斗终生。
警察
韩国
본인은 공직자로서 긍지와 보람을 가지고 국가와 국민을 위하여 신명을 바칠 것을 다짐하면서 다음과 같이 선서합니다. 1.본인은 법령을 준수하고 상사의 직무상의 명령에 복종한다. 1.본인은 국민의 편에 서서 정직과 성실로 직무에 전념한다. 1.본인은 창의적인 노력과 능동적인 자세로 소임을 완수한다. 1.본인은 재직 중은 물론 퇴직 후에라도 직무상 알게 된 기밀을 절대로 누설하지 아니한다. 1.본인은정의의 실천자로서 부정의 발본에 앞장선다.
香港
I will well and faithfully serve Her Majesty and Her Heirs and Successors according to law as a police officer, I will obey, uphold and maintain the laws of the Colony of Hong Kong, I will execute the powers and duties of my office honestly, faithfully and diligently without fear of or favour to any person and with malice or ill will towards none, and I will obey without question all lawful orders of those set in authority over me.
余兹身为警员,愿竭忠诚,依法效力英女皇及其皇储与继统人。余愿遵守,维护,并维持香港之法律。余复愿以不屈不挠,毋枉毋徇之精神,一秉至公,励行本人之职,并愿绝对服从本人上级长官之一切合法命令,此誓。
台湾
余誓以至誠,恪遵國家法令,盡忠職 守,報效國家;依法執行任務,行使職權;勤謹謙和,為民服務。如違誓 言,願受最嚴厲之處罰,謹誓。
检察官
나는 이 순간 국가와 국민의 부름을 받고 영광스러운 대한민국 검사의 직에 나섭니다. 공익의 대표자로서 정의와 인권을 바로 세우고 범죄로부터 내 이웃과 공동체를 지키라는 막중한 사명을 부여받은 것입니다. 나는 불의의 어둠을 걷어내는 용기 있는 검사, 힘없고 소외된 사람들을 돌보는 따뜻한 검사, 오로지 진실만을 따라가는 공평한 검사, 스스로에게 더 엄격한 바른 검사로서, 처음부터 끝까지 혼신의 힘을 다해 국민을 섬기고 국가에 봉사할 것을 나의 명예를 걸고 굳게 다짐합니다.
reference
Ansible 入门篇一:简单介绍及使用
Ansible 是使用 Python 开发的自动化运维工具,如果这么说比较抽象的话,那么可以说 Ansible 可以让服务器管理人员使用文本来管理服务器,编写一段配置文件,在不同的机器上执行。
Ansible 使用 YAML 作为配置文件,YAML 是一个非常节省空间,并且没有丧失可读性的文件格式,其设计参考了很多语言和文件格式,包括 XML,JSON,C 语言,Python,Perl 以及电子邮件格式 RFC2822 等等。
Ansible 解决的问题正是在运维过程中多机器管理的问题。当有一台机器时运维比较简单,当如果要去管理 100 台机器,复杂度就上升了。使用 Ansible 可以让运维人员通过简单直观的文本配置来对所有纳入管理的机器统一进行管理。如果再用简单的话来概述 Ansible 的话,就是定义一次,无数次执行。
Ansible 是如何做到这件事情的呢?主要是划分了下面几个部分,具体的内容后文详解:
- 定义目标机器列表,也就是需要管理的机器
- 定义配置,使用 YAML 文件配置任务
- 执行具体任务
Ansible 的特性
- 低学习成本
- 无需在服务器中安装客户端,基于 SSH 工作,可并行执行
- 无需服务端,直接终端命令即可
- 管理的对象可以包括物理机,虚拟机,容器等等
- 使用 YAML 格式文件编排 playbook
Ansible 的组成元素
Ansible 中的一些概念。
- control node: 控制节点,可以在任何安装了 Python 环境的机器中使用 ansible,两个重要的可执行文件在
/usr/bin/ansible和/usr/bin/ansible-playbook - managed node: 被控制的节点
- inventory: 需要管理的节点,通常配置成
hostfile文件 1 - modules: ansible 进行自动化任务时调用的模块,社区提供了非常多 modules
- Task: Ansible 的执行单元
- playbook: 编排多个任务
- roles: roles 是将 playbook 划分多个部分的机制
- plugins: ansible 插件
工作流程:
- 读取配置
- 获取机器列表及分组配置
- 确定执行模块和配置,modules 目录动态读取
- Runner 执行
- 输出
安装
Ansible 的安装方法非常多,PPA,源码安装都可以。2
Ubuntu 下安装:
sudo apt update
sudo apt install software-properties-common
sudo apt-add-repository --yes --update ppa:ansible/ansible
sudo apt install ansible
如果不想 PPA,也可以直接安装:
sudo apt-get install -y ansible
# or
sudo pip install ansible
在 macOS 上:
brew install ansible
源码安装
从源码安装:
sudo apt-get install -y libffi-dev libssl-dev python-dev
sudo pip install paramiko PyYAML Jinja2 httplib2 six pycrypto
git clone https://github.com/ansible/ansible.git --recursive
cd ansible
git pull --rebase
git submodule update --init --recursive
配置 Bash:
source ./hacking/env-setup
通过 Python pip 安装
sudo pip install --trusted-host mirrors.aliyun.com
--index-url=http://mirrors.aliyun.com/pypi/simple/  ansible==2.7.1
相关配置
ansible.cfg
ansible.cfg 文件是 Ansible 中最主要的配置文件,ansible 寻找配置文件按照如下的优先级进行:
- 由环境变量
ANSIBLE_CONFIG指定的文件 ./ansible.cfg(ansible.cfgin the current directory)~/.ansible.cfg(.ansible.cfgin your home directory)/etc/ansible/ansible.cfg
最简单的 ansible.cfg 配置示例:
[defaults]
hostfile = hosts
remote_user = root
remote_port = 22
host_key_checking = False
说明:
hostfile文件指定了当前文件夹下的 hosts 文件。hosts 文件中会配置需要管理的机器 host- 配置 SSH 免密登录的文章可以参考之前的文章.
remote_user配置默认操作的用户,如果没有配置,默认会使用当前用户host_key_checking: 禁用 SSH key host checking
inventory
在上面的配置中可以看到 inventory 指定了一个 hosts 文件,这个文件用来对远程服务器 Hosts 进行管理。
默认的文件路径在 /etc/ansible/hosts。
这里的 inventory 可以看成需要管理的节点的配置,可以直接配置到全局,然后使用 all 来引用,也可以用分组的形式来引用。
未分组形式
比如,未分组形式定义:
xxx.einverne.info
einverne.info
12.12.12.12
192.168.2.1
192.168.2.200
10.0.0.1
分组形式
或者采用分组形式,用方括号表示下面的 HOST 都属于 webserver 这个组:
[webserver]
127.0.0.1
foo.example.com
配置范围
如果有多个 HOST 可以用如下语法添加多个:
[webservers]
www[001:006].example.com

[dbservers]
db-[99:101]-node.example.com
或者配置别名:
dbserver1 ansible_ssh_host=127.0.0.1 ansible_ssh_port=22 color=red
dbserver2 ansible_ssh_host=127.0.0.2 ansible_ssh_port=220


[dbserver] #group
dbserver1
dbserver2

[forum:children] #groups of groups
webserver
dbserver
inventory 中可以配置使用别名,但是推荐在 ssh config 中进行配置管理,编辑 vi ~/.ssh/config:
Host ds
	HostName einverne.info
	Port 22
	User username

Host aws1
	HostName aws.einverne.info
	Post 22
	User demo-username

Host oracle1
	HostName 140.1.1.1
	Port 22
	User some-username
我个人使用 assh 来对 SSH config 进行管理。
然后就可以在 Ansible 的 inventory 中配置使用 ds, aws1 或者 oracle1 来指定 host。
更多 inventory 的配置可以参考官方文档
inventory 同样配置用来管理 AWS EC2,或者 OpenStack。3
Ansible 使用
ansible 命令的基本使用方法:
ansible <pattern> -m <module_name> -a <module_arguments>
说明:这一行命令会定义并在一系列 host 上执行一个 playbook 任务。
ad-hoc command
ad-hoc 命令可以执行单一的任务,ad-hoc 命令很简单,但不能复用,在了解 playbook 之前可以先体验一下 ad-hoc,感受一下 Ansible 的强大。
简单示例:
# 在指定的 host1 节点上执行
ansible host1 -a "/bin/echo hello"
# 在多个节点执行
ansible host1,host2 -a "/bin/echo hello"
ansible host1:host2 -a "/bin/echo hello"
# ping 全部节点
ansible all -m ping
# 一组节点
ansible webservers -m service -a "name=httpd state=restarted"
# 多组节点
ansible webservers:dbservers -m ping
# 排除节点,在 groupA 但不在 groupB
ansible groupA:!groupB -m ping
# 多组节点的交集,既在 groupA 也在 groupB 中的节点
ansible groupA:&groupB -m ping
这里选择节点的方式可以有很多种,甚至可以选择组节点中的第几个,或者用正则匹配一些等等。4
Ansible module
-m 选项后面的就是 Ansible 的 module,常见的 module,比如上面例子中的 ping,就是用来检测连通性的。
下面介绍一下常用的 module 方便快速进入 Ansible 的世界,理解了下面这些 module 也比较方便之后学习更加复杂的模块。
setup
setup module 用来查看远程主机信息:
ansible all -m setup
每个被管理的节点在接受并运行管理命令之前都会将自己的信息报告给 Ansible 主机。
command
command 命令模块用于在远程主机执行命令,但是不能使用变量,管道等。
执行命令:
ansible all -m command -a "ls -al ."
ansible all -m command -a "date"
# 切换到 sub-dir 目录,创建文件
ansible all -m command -a "chdir=sub-dir creates=test.file ls"
# 删除文件
ansible all -m command -a "chdir=sub-dir removes=test.file ls"
cron
cron 模块用于配置 crontab 定时任务:
ansible host -m cron -a 'minute="*/10" job="/bin/echo hello" name="test cron job"'
执行这以命令之后就会给 host 主机的 crontab 中写入
#Ansible: test cron job
*/10 * * * * /bin/echo hello
可以通过如下命令验证:
ansible host -a 'crontab -l'
如果要移除 cron 可以:
ansible host -m cron -a 'minute="*/10" job="/bin/echo hello" name="test cron job" state=absent'
user
user 模块用来管理用户账户。
# 新增用户
ansible all -m user -a 'name="einverne"'
# 删除用户
ansible all -m user -a 'name="einverne" state=absent'
和用户相关的字段:
name    用户名
uid     uid
state   状态
group   属于哪个组
groups  附加组
home    家目录
createhome  是否创建家目录
comment 注释信息
system  是否是系统用户
user module 更多的说明可以参考官网
group
组管理同样拥有这些配置:
gid     gid
name    组名
state   状态
system  是否是系统组
file
file module 可以用来设置文件属性。
# 创建 soft link
ansible all -m file -a "src=/etc/resolv.conf dest=/tmp/resolv.conf state=link"
# 删除 soft link
ansible all -m file -a "path=/tmp/resolv.conf state=absent"
copy
复制本地文件到远程主机指定位置
# 复制本地文件到远程主机,并授予权限
ansible host -m copy -a "src=/etc/ansible/ansible.cfg dest=/tmp/ansible.cfg owner=root group=root mode=644"
# 直接使用 content
ansible host -m copy -a 'content="test content" dest=/tmp/test'
shell
在远程执行 shell 脚本,可以使用管道等
ansible all -m shell -a "~/setup.sh"
ansible all -m shell -a 'echo demo > /tmp/demo'
更多 module 可以使用 ansible-doc -l 查看。
小结
看到这里的话,相信对 ansible 的 module 已经有了一个大致的了解,Ansible 官网提供了非常多的 module 使用说明。
但是你会发现一个问题,所有的这些命令都是一次性使用的,而无法做到复用,除非你拷贝这一行命令执行多次。所以 Ansible 也可以通过配置文件的方式,将这些操作记录下来,以文本的方式进行管理,这就是下面要说到的 Ansible playbook。
Ansible playbook
上面提到 ad-hoc 可以执行一次性的命令,但如果要把多个 task 组织起来,那就不得不提到 playbook, playbook 可以编排有序的任务,可以在多组主机间,有序执行任务,可以选择同步或者异步发起任务。
下面以一个安装 Docker 的例子做演示:
定义了变量的文件 var/default.yml:
---
create_containers: 4
default_container_name: docker
default_container_image: ubuntu
default_container_command: sleep 1d
playbook.yml 文件:
---
- hosts: all
  become: true
  vars_files:
    - vars/default.yml

  tasks:
    - name: Install aptitude using apt
      apt: name=aptitude state=latest update_cache=yes force_apt_get=yes

    - name: Install required system packages
      apt: name= state=latest update_cache=yes
      loop: [ 'apt-transport-https', 'ca-certificates', 'curl', 'software-properties-common', 'python3-pip', 'virtualenv', 'python3-setuptools']

    - name: Add Docker GPG apt Key
      apt_key:
        url: https://download.docker.com/linux/ubuntu/gpg
        state: present

    - name: Add Docker Repository
      apt_repository:
        repo: deb https://download.docker.com/linux/ubuntu bionic stable
        state: present

    - name: Update apt and install docker-ce
      apt: update_cache=yes name=docker-ce state=latest

    - name: Install Docker Module for Python
      pip:
        name: docker

    - name: Pull default Docker image
      docker_image:
        name: ""
        source: pull

    # Creates the number of containers defined by the variable create_containers, using values from vars file
    - name: Create default containers
      docker_container:
        name: ""
        image: ""
        command: ""
        state: present
      with_sequence: count=
说明:
- hosts: 指定了哪些服务器执行该 playbook 中的 tasks
- tasks: 一系列执行的任务,在上面的例子中就是安装必要的依赖,然后安装 Docker,随后 pull 镜像,并启动容器
使用如下命令执行 playbook
ansible-playbook playbook.yml -f 10
-f 表示的是指定并发进程来执行任务。
when 语句
在 task 后面可以增加 when 用于条件,比如只有系统是 Debian 才执行命令:
tasks:
  - name 'test when'
    command: /bin/echo hello
    when: ansible_os_family == 'Debian'
循环
如果需要重复执行一个任务,可以使用循环,将需要循环的内容定义为 item,然后通过 with_items 语句指定列表,比如新建两个用户:
- name: add user
  user: name= state=present
  with_items:
    - user1
    - user2
上面语句的功能等同于下面的语句:
- name: add user testuser1
 user: name=user1 state=present
- name: add user testuser2
 user: name=user2 state=present
如果还要定义 group,可以使用 key-value 键值对:
- name: add multiple item
  user: name= state=present groups=
  with_items:
    - { name: 'user1', groups: 'g1'}
    - { name: 'user2', groups: 'root'}
role
再来看一个例子:
- hosts:webservers
  roles:
	- tmux
这里 role 定义了 tmux(tmux 编译安装),则表示用 tmux 执行了一系列的命令。role 由其他一些组件组成:
roles/
   tmux/
	 tasks/
	 handlers/
	 files/
	 templates/
	 vars/
	 defaults/
	 meta/
在 tasks 目录下新建 mail.yml:
- name: install tmux package
  package:
	name:
	  - libevent
	  - ncurses
	  - tmux
	state: latest
如果想了解更多拆分 playbook 的方法,可以到官网查看更多 include, role 相关的内容。
Check Mode (dry-run)
当使用 check mode 运行 ansible-playbook 时,Ansible 不会在远程服务器上执行任何命令。
ansible-playbook foo.yml --check
ansible-galaxy
创建 role
ansible-galaxy 命令和 Ansible 命令绑定到了一起,可以通过 ansible-galaxy 来初始化 role.
ansible-galaxy init pyenv
得到:
➜ tree pyenv
pyenv
├── defaults
│   └── main.yml
├── files
├── handlers
│   └── main.yml
├── meta
│   └── main.yml
├── README.md
├── tasks
│   └── main.yml
├── templates
├── tests
│   ├── inventory
│   └── test.yml
└── vars
	└── main.yml
在使用时,每一个目录都需要包含一个 mail.yml 文件:
tasks: 包含 role 需要执行的任务清单handlers: 包含 handlers, 可能被 role 用到defaults: 默认变量,Using Variablesvars: 其他被 role 用到的变量 Variablefiles: 包含可能被 role 用到的文件templates: 包含可能被 role 用到的 templatesmeta: 定义 role 的 meta data
YAML 文件可以被引入,比如不同的系统版本:
# roles/example/tasks/main.yml
- name: added in 2.4, previously you used 'include'
  import_tasks: redhat.yml
  when: ansible_facts['os_family']|lower == 'redhat'
- import_tasks: debian.yml
  when: ansible_facts['os_family']|lower == 'debian'

# roles/example/tasks/redhat.yml
- yum:
	name: "httpd"
	state: present

# roles/example/tasks/debian.yml
- apt:
	name: "apache2"
	state: present
延伸
其他的运维管理工具 puppet、cfengine、chef、func、fabric.
Redhat 给 Ansible 做了一套 GUI,叫做 Ansible Tower,感兴趣可以了解一下。
reference
- https://docs.ansible.com/
- http://www.ansible.com.cn/docs/
- https://galaxy.ansible.com/docs/
- https://www.ansible.com/overview/how-ansible-works
- https://spacelift.io/blog/ansible-playbooks
-
https://docs.ansible.com/ansible/latest/user_guide/intro_inventory.html#intro-inventory ↩
-
https://docs.ansible.com/ansible/latest/installation_guide/intro_installation.html ↩
-
https://docs.ansible.com/ansible/latest/user_guide/intro_dynamic_inventory.html ↩
-
https://docs.ansible.com/ansible/latest/user_guide/intro_patterns.html ↩
解析 bpmn 文件
Business Process Model and Notation (BPMN) is a graphical representation for specifying business processes in a business process model.
Choice
可供选择的方案,如下。
jBPM
jBPM 是一个用 Java 写的开源工作流引擎,可以用来执行 BPMN 2.0 定义的工作流。
- Apache License 2.0
EasyBPMN
EasyBPMN Toolbox is a powerful Java library for BPMN 2.0. It can parse and manipulate BPMN 2.0 files easily by providing a Java model for any BPMN 2.0 compliant business process.
EMF Java Api
EMF 是 Eclipse 下面的一个建模工具,我没有具体细看,但 BPMN 2.0 的规范定义,本质上 bpmn 文件就是一个 xml 格式的文件,如果知道 bpmn 文件的定义规范,使用任意的 xml 解析工具都可以解析出想要的内容。
BPMN2 model is based on EMF model (org.eclipse.bpmn2 project, model folder, BPMN20.ecore file). You can use EMF Java Api to create, read or modify BPMN2 models.
Business Process Model And Notation
BPMN 2.0 规范
Solution
在搜罗了一圈之后在 jBPM 项目中发现了下面的代码。XmlProcessDumper 类实现了 bpmn 文件的解析。
InputStream inputBpmn = getClass().getResourceAsStream("/BPMN2-BrokenStructureRef.bpmn2");
XmlProcessDumper dumper = XmlProcessDumperFactory.getXmlProcessDumperFactoryService().newXmlProcessDumper();
Assert.assertNotNull(dumper);
String processXml = new String(IoUtils.readBytesFromInputStream(inputBpmn), "UTF-8");
Assert.assertNotNull(processXml);
org.kie.api.definition.process.Process proc = dumper.readProcess(processXml);
Assert.assertNotNull(proc);
Assert.assertEquals("BrokenStructureRef", proc.getId());
reference
git subtree 简单使用记录
昨天在和朋友讨论两个项目双向同步的问题,比如,两个从同一分支拉出来的两个独立项目各自发展,但又要求定时双向同步的时候,虽然提出了用 remote 可以临时解决一下。不过后来又和朋友讨论起 git subtree 来,在此之前,我如果有需要在项目内部依赖外部独立的项目时,我一般都使用 git submodule 来解决。不过昨天搜索了一下之后发现 git subtree 似乎更加强大,并且已经成为替代 git submodule 的事实方案。所以这里来学习一下。
在使用 git subtree 之前如果你没有用过 git submodule,这里先进行一些说明。对于 git submodule 而言,在本地的代码库中可能存在多个 git 代码仓库,而 git subtree 就只有一个代码库。
Sub module vs Sub tree 对比
这两者都可以将另外一个项目作为主项目的一个子目录而作为依赖添加进来,但是实现的方式大有区别。
- 对父项目的占用区别:对于父项目而言,如果使用 submodule 会在父项目中新增一个
.gitmodule的文件来记录父项目添加的子 module,而使用 subtree 则会将子项目完整的克隆到父项目的一个文件夹中。 - 在 clone 子项目步骤上:使用 submodule 需要执行多个步骤,首先拉取主项目,然后需要使用 submodule 命令单独更新 submodule;而使用 subtree 则只需要使用 clone 来获取主项目的代码,子项目代码会一并被拉取
- push 子项目:submodule 因为将子项目视为独立的项目,可以直接在子项目中进行 push;而使用 subtree 则需要手动进行对比
- pull 子项目:submodule pull 子项目后需要,在父项目再进行提交
git submodule update --recursive --remote;而使用 subtree 则直接 pull 即可
为什么要使用 git subtree?
git subtree 可以让一个 repository 嵌入到另一个项目的子目录中。
- 管理方便,对于主项目中的成员无需关心额外的 git 工作流,使用最基本的 git 工作流即可
- 在拉取代码的时候,一行 clone 命令可以立即获得包括子项目在内的所有的项目文件,而不是像 git submodule 一样还需要额外的 update 命令
- git subtree 不会像 gitmodule 一样引入 metadata 文件来管理,没有
.gitmodule这样的文件,git subtree 的使用对于项目中其他成员可以透明 - 子项目中的内容可以无缝的被修改,并且可以选择性同步到 upstream 中
什么时候使用 git subtree?
- 多个项目共同使用一整块代码库,并且这个依赖的代码库在快速迭代的时候
- 将一部分的代码从一个仓库独立出去,并且保留这个部分提交历史的时候
git subtree 相关命令
常用的 git subtree 命令:
git subtree add   --prefix=<prefix> <commit>
git subtree add   --prefix=<prefix> <repository> <ref>
git subtree pull  --prefix=<prefix> <repository> <ref>
git subtree push  --prefix=<prefix> <repository> <ref>
git subtree merge --prefix=<prefix> <commit>
git subtree split --prefix=<prefix> [OPTIONS] [<commit>]
在父仓库中添加子项目
和 git submodule 一样,在使用 subtree 的时候也需要显式的指定需要添加的子项目
git subtree add --prefix=foo https://github.com/einverne/foo.git master --squash
解释:
--squash是将 subtree 的改动合并到一个 commit,不用拉取子项目完整的历史纪录- 这里
--prefix后面的=也可以使用空格,注意这里的foo就是项目克隆后在本地的目录名 - 命令中的
master指的是 subtree 项目的分支名 - 可以使用
git status和git log查看提交
使用 git subtree 添加项目后,subtree 就将原来的项目作为这个主项目的一个普通文件夹来看待了,对于父级项目而言完全无缝透明。上面的命令就是将 foo 这个项目添加到主项目中 foo 文件夹下。
日常更新的时候,正常的提交代码,如果更改了 foo 目录中的内容也正常的提交即可。
更新子项目仓库
如果依赖的子项目更新了,可以通过如下命令更新:
git subtree pull --prefix=foo https://github.com/einverne/foo.git master --squash
上面命令执行后,就可以将 foo 仓库中 master 上的更新更新到本地,--squash 表示只会在父项目生成一个 commit 提交。
将更改推送到子项目仓库
假如在修改代码时修改了依赖的 foo 中的代码,那么可以将这部分代码推送到远端仓库
git subtree push --prefix=foo https://github.com/einverne/foo.git master
看到这里可能发现,每一次操作 subtree 添加的项目时都需要敲一大段 URL 地址,这里可以使用 remote 来简化命令:
git remote add -f foo https://github.com/einverne/foo.git
然后
git subtree add --prefix=foo foo master --squash
git subtree pull --prefix=foo foo master --squash
git subtree push --prefix=foo foo master
到这里其实我们就可以发现,利用 subtree 或者 submodule 也好,都可以很方便的同步子项目,尤其是很多项目都依赖的那个项目。比如 A,B 都依赖与 Z,项目,那么使用这种方式可以很方便的在不同 A,B 项目间共享对 Z 的修改。比如 A,B 都依赖与 Z,项目,那么使用这种方式可以很方便的在不同 A,B 项目间共享对 Z 的修改。
将推送的修改合并成一次提交
git subtree push 会将父项目中的提交每一次都进行提交,这会导致对于子项目来说无意义的提交信息,但是 git subtree 并没有提供类似 squash 的方式可以将多次提交合并成一次提交,但是 git subtree 提供了分支的特性,可以在父项目中将修改推送到某一个分支,然后在子项目中使用 squash merge 将修改合并到主干分支。
git subtree push --prefix=foo foo feature
这会在 foo 的仓库中创建一个叫做 feature 的分支。然后可以从 feature 分支合并回 master 分支。
一旦最新的提交都合并到 master 分支,可以通过 pull 来更新
git subtree pull --prefix=foo foo master --squash
这会在主项目中创建另外一个提交,包括了子项目中所有的修改。
这样的方式唯一的缺点就是会在父项目中产生一些多余的提交信息。
常见的使用场景
典型的使用场景就是当 A,B 项目同时依赖 Z 项目,需要对 Z 项目进行管理的时候。
使用 git subtree 来管理 vim plugin
虽然可以用 subtree 来管理 vim plugins,但我个人跟倾向于使用 vim-plug 来管理 Vim 的插件。
这里不过是拿 vim plugin 管理来作为一个例子。1
# add
git subtree add --prefix .vim/bundle/vim-fugitive https://github.com/tpope/vim-fugitive.git master --squash
# update
git subtree pull --prefix .vim/bundle/vim-fugitive https://github.com/tpope/vim-fugitive.git master --squash
使用 git subtree 来管理博客的主题
无论是 WordPress 还是静态内容生成器 Hexo,Hugo 之类,他们的主题都是主项目下的一个文件夹,如果主题自身是一个仓库的话,那么可以直接使用 subtree 将主题放到主项目中来管理,修改也可以同步提交到主项目中,如果想要提交回主题本身也可以很方便的实现。
git subtree push --prefix=foo foo master --squash
push 的时候添加 --squash 会将多个提交合并成一个。
缺点
固然 subtree 有很多的优点,解决了 submodule 存在的一些问题,但是 subtree 也有其自己的问题。
子项目将修改提交到 upstream 的过程变得复杂
在 submodule 时,子项目是一个单独的项目,和所有的 git 管理的项目一样,可以在子项目中提交,提交再 push 到 upstream ,并且每一个 submodule 都有自己完整的提交历史。
而在 subtree 中因为对子项目的所有修改已经和主项目混合到了一起,所以需要单独对子项目提交,命令:
git subtree push --prefix=foo foo master
在 subtree 执行 push 命令时,git subtree 会为子项目生成新的提交,这个时候就会有一个问题。假如主项目提交过多,那么在 push 到子项目时会花费大量的时间来重新计算子项目的提交。并且因为每次 push 都是重新计算的,所以本地仓库和远端仓库的提交总是不一样的,这会导致 git 无法解决可能的冲突。
基于这些原因,git subtree 提供了 split 命令。
Extract a new, synthetic project history from the history of the subtree. The new history includes only the commits (including merges) that affected , and each of those commits now has the contents of at the root of the project instead of in a subdirectory. Thus, the newly created history is suitable for export as a separate git repository. After splitting successfully, a single commit id is printed to stdout. This corresponds to the HEAD of the newly created tree, which you can manipulate however you want. Repeated splits of exactly the same history are guaranteed to be identical (ie. to produce the same commit ids). Because of this, if you add new commits and then re-split, the new commits will be attached as commits on top of the history you generated last time, so ‘git merge’ and friends will work as expected. Note that if you use ‘-squash’ when you merge, you should usually not just ‘-rejoin’ when you split.
当使用 split 命令后,使用 git subtree push,git 只会计算 split 后的新提交。23
这里需要注意:如果 push 使用了 --squash 合并提交,那么 split 时不能使用 --rejoin 参数。运行上面的命令后主项目中就多了一个 foo-branch 的分支,这个分支作为子项目的起点,下次 push 时就只会从这个点开始重新计算。
需要学习 subtree 的 merge 方法
使用 subtree 的时候,如果能够 pull 下来当然 OK,但是一旦出现 Conflict,过程就比较复杂了,甚至需要专门的 git subtree merge strategy 来解决。
假设把 Bproject 作为子项目
# -f flag tell git to immediately fetch the commits after adding
git remote add -f Bproject /path/to/B
准备 merge:
git merge -s ours --no-commit --allow-unrelated-histories Bproject/master
这告诉 git 准备一次 merge commit,使用 ours merge strategy 来告诉 git 我们需要 merge 的结果是 HEAD,然后将 project b 添加到 repository:
git read-tree --prefix=dir-B/ -u Bproject/master
read-tree 命令读取 B 项目的 master-tree 到 index 中,然后将其保存到给定的目录中 dir-B/,注意这里的目录结尾必须有 /,-u 选项让 read-tree 同样更新 working 目录中的内容。
最后提交:
git commit -m "Merge Project B into dir-B"
以后的更新,只需要 pull 即可
git pull -s subtree Bproject master
上面的流程可以看到,虽然使用 subtree 将项目中包含另一个项目的细节对项目的成员隐藏了,但实际上在产生冲突时需要管理者特别注意。456
subtree 如何切换分支
使用 git subtree 加入到父项目的仓库,如果要切换分支,可以直接将 subtree 删掉,然后新加入子项目的分支即可。
git rm <subtree>
git commit
git subtree add --prefix=<subtree> <repository_url> <subtree_branch>
移除 subtree
如果有一天引入的 subtree 不再有用,那么整个 subtree 可以从项目中删除。
git rm -r subtree_folder
git commit -m "Remove subtree"
这种方式是删除整个 subtree,然后提交,但是问题在于 git log 中还会留有 subtree 的提交历史。
还可以使用 filter-branch 来重写提交历史:
git filter-branch -f --index-filter "git rm -r -f -q --cached --ignore-unmatch subtree_folder" --prune-empty HEAD
这种方式可以将 subtree 的提交历史也删除。
使用建议
就和上文所说那样,因为对 subtree 目录的修改和主项目是混合在一起的。所以为了让 commit messages 清晰,可以对主项目和子项目的修改分开进行。当然如果不在意子项目的 commit messages,那么一起提交,然后在对 subtree push 的时候再统一对 commit message 进行修改也可以。
reference
- https://github.com/apenwarr/git-subtree/
- https://www.atlassian.com/blog/git/alternatives-to-git-submodule-git-subtree
- https://lostechies.com/johnteague/2014/04/04/using-git-subtrees-to-split-a-repository/
-
http://endot.org/2011/05/18/git-submodules-vs-subtrees-for-vim-plugins/ ↩
-
https://blog.walterlv.com/post/performance-of-git-subtree.html ↩
-
https://github.com/apenwarr/git-subtree/blob/master/git-subtree.txt
git subtree split [–rejoin] –prefix=foo –branch foo-branch ↩
-
https://mirrors.edge.kernel.org/pub/software/scm/git/docs/howto/using-merge-subtree.html ↩
-
https://help.github.com/en/github/using-git/about-git-subtree-merges ↩
Prometheus: 监控系统和时序数据库
Prometheus 是一个用 Go 写的监控系统,最早由 SoundCloud 开发并开源,Prometheus 内置一个时序数据库。Prometheus 受到 Google borgmon 监控系统启发,2012 年起源于 SoundCloud 内部,后来成为第二个加入 Cloud Native Computing Foundation 的项目。
It collects metrics from configured targets at given intervals, evaluates rule expressions, displays the results, and can trigger alerts if some condition is observed to be true.
Prometheus 以固定的频率从配置的目标采集监控指标信息,经过计算,显示结果,并且观察到某些条件成真时发出告警。
Prometheus 区别于其他监控系统的地方在于:
-
一个多维的数据模型(Dimensional data model 通过指标名字定义的时序以及键值的组合)
- 时序数据通过 metric 和 key-value 区分
- metric 可以设置任意维度标签
- 双精度浮点,Unicode 标签
- 灵活强大的查询语言 ([[PromQL]]),可以轻易的利用其多维信息
- Prometheus 服务是一个单独的二进制文件,可以直接在本地工作
- 无需依赖分布式存储;单服务器节点是自治的 (single server nodes are autonomous)
- 高效:每个采样点只有 3.5 bytes 占用,单一服务每秒可以处理百万级别 metrics
- 通过在 HTTP 上的 pull 模型实现采集
- pushing timeseries 通过中间网关支持
- 监控目标可以通过服务发现 (service discovery) 或者静态配置 (static configuration) 实现
- 多种图形和仪表板支持,结合 Grafana 可以实现更丰富的展示
- 支持分层和水平的联合 (federation)
SoundCloud 在其官方博客 Prometheus: Monitoring at SoundCloud 中提到设计这套监控系统的目标:
A multi-dimensional data model, so that data can be sliced and diced at will, along dimensions like instance, service, endpoint, and method.
Operational simplicity, so that you can spin up a monitoring server where and when you want, even on your local workstation, without setting up a distributed storage backend or reconfiguring the world.
Scalable data collection and decentralized architecture, so that you can reliably monitor the many instances of your services, and independent teams can set up independent monitoring servers.
Finally, a powerful query language that leverages the data model for meaningful alerting (including easy silencing) and graphing (for dashboards and for ad-hoc exploration).
除了上面提到的 Prometheus 特性,在后来的发展中,Prometheus 不断的新增特性,比如 服务发现,外部存储,告警规则和多种通知方式。
Prometheus 目前已经支持 Kubernetes, etcd, Consul 等多种服务发现机制。
为了扩展 Prometheus 的采集能力和存储能力,Prometheus 引入了”联邦”的概念。多个 Prometheus 组成两层联邦,上层定时从下层 Prometheus 节点获取数据并汇总,部署多个联邦节点实现高可用。下层节点分别负责不同区域的数据采集,下层 Prometheus 节点可以被部署到单独的机房充当代理。
Prometheus 组成
Prometheus 有很多可选组件:
- Prometheus Server: 收集存储时间序列,并对外提供 API,提供 PromQL 查询语言
- Client:为需要监控的服务生成相应的 metrics 并暴露给 Prometheus Server,Server pull 时直接返回实时状态
- Push Gateway:用户可以主动向其中 push 数据,用于短期 job
- Exporters: 暴露已有的第三方服务 metrics,等待 server 拉取
- Alertmanager: 从 Prometheus server 接收到 alerts 后,进行数据处理,发出报警,报警方式有:邮件,Slack,pagerduty, OpsGenie, webhook 等
大致工作流:
- Prometheus Server 定期从配置的目标 (Target) 或者 exporters 中 pull 拉取 metrics,或者接收来自 Pushgateway 发送的 metrics
- Prometheus 在本地存储 metrics 数据,并通过一定规则清洗整理数据,把得到的结果记录到时间序列
- 得到数据后,根据制定的报警规则,计算报警指标
- Alertmanager 根据配置,对接收到的报警进行处理
- 在图形界面中可视化采集的数据
从上面的介绍能比较清晰的看到 Prometheus 定时从被监控的组件中获取监控数据,而任意的组件只要提供对应的 exporter (Prometheus 这里使用 HTTP 协议) 就可以快速接入监控。这种模式就特别适合微服务,或者容器。而目前常见的组件,Prometheus 都提供了对应的 exporter,比如 Haproxy, Nginx, MySQL, Linux 系统信息等等。
相关概念
数据模型
时间序列由 metric 名和一组 key-value 标签组成。
- metric 名:语义的名字,一般用来表示 metric 功能,比如: http_requests_total, http 总请求数。metric 名由 ASCII 字符,数字,下划线,冒号组成,必须满足
[a-zA-Z_:][a-zA-Z0-9_:]*1 - 标签:一个标签就是一个维度,
http_requests_total{method="Get"}表示所有 http 请求中 Get 请求,method 就是一个标签,标签需要满足[a-zA-Z_:][a-zA-Z0-9_:]*1 - 样本:实际时间序列,每个序列包括 float64 值和一个毫秒级时间戳
组合样式:
<metric name>{<label name>=<label value>, ...}
举例:
http_requests_total{method="POST",endpoint="/api/tracks"}
metric 类型
Client 提供如下 metric 类型:2
- Counter: 累加 metric,只增不减的计数器,默认值为 0,典型应用场景:请求个数,错误次数,执行任务次数
- Gauge: 计量器,与时间无关的瞬时值,值可增可减,比如:当前温度,CPU 负载,运行的 goroutines 个数,数值可以任意加减,node_memory_MemFree 主机当前空闲大小,node_memory_MemAvailable 可用内存
- Histogram:柱状图,直方图,表示一段时间内的资料信息,用于请求时间,响应大小,可以对结果进行采样,分组和统计
- Summary: 类似 Histogram,但提供了 quantiles 功能,昆虫安装百分比划分结果,比如 quantile 为 0.99,表示取采样数据中的 95 数据。
Installation & Usage
Prometheus Server
Prometheus Server 可以有很多安装方式,Docker,Ansible,Chef,Puppet,SaltStack 等等,具体可以参考官网。
通过 Docker 安装:
docker run --name prometheus -d \
-p 9090:9090 \
-v ~/docker/prometheus:/etc/prometheus \
prom/prometheus
如果把 Prometheus 的配置映射到了本地,可以直接去 ~/docker/prometheus/ 下查看配置。
或者使用 Docker compose:
version: '2'
services:
  prometheus:
  image: prom/prometheus
  volumes:
    - ./prometheus.yml:/etc/prometheus/prometheus.yml
  command:
    - '--config.file=/etc/prometheus/prometheus.yml'
  ports:
    - '9090:9090'
Node exporter
Prometheus 主要用于监控 Web 服务,如果要监控物理机,则需要在机器上安装 node exporter, exporter 会暴露 metrics 给 Prometheus,包括 CPU 负载,内存使用,磁盘 IO,网络等等。[^exporter]
[^exporter](https://github.com/prometheus/node_exporter#enabled-by-default)
node exporter 安装步骤:3
在官网 获取最新的 node exporter 地址:
curl -LO https://github.com/prometheus/node_exporter/releases/download/v0.18.1/node_exporter-0.18.1.linux-amd64.tar.gz
解压
tar -xzvf node_exporter-0.18.1.linux-amd64.tar.gz
移动到 /usr/local/bin 目录
sudo mv node_exporter-0.18.1.linux-amd64/node_exporter /usr/local/bin/
创建 node exporter service,首先创建用户,然后添加服务
sudo useradd -rs /bin/false node_exporter
sudo vi /etc/systemd/system/node_exporter.service
保存如下内容:
[Unit]
Description=Node Exporter
After=network.target

[Service]
User=node_exporter
Group=node_exporter
Type=simple
ExecStart=/usr/local/bin/node_exporter

[Install]
WantedBy=multi-user.target
重新加载 system daemon,启动服务:
sudo systemctl daemon-reload
sudo systemctl start node_exporter

sudo systemctl status node_exporter
开机启动:
sudo systemctl enable node_exporter
服务启动后会监听 9100 端口,使用如下命令验证:
curl http://localhost:9100/metrics
或者查看 9100 端口是否起来 netstat -anp | grep 9100.
配置这台服务器作为 Prometheus Server 的 Target 监控目标。
sudo vi /etc/prometheus/prometheus.yml
在 scrape 配置下,记得 IP 换成自己的
- job_name: 'node_exporter_metrics'
  scrape_interval: 5s
  static_configs:
    - targets: ['10.10.0.1:9100']
重启 Prometheus 服务,如果是 Docker 起的,则需要重启容器
sudo systemctl restart prometheus
到 Prometheus 后台 Targes 下验证是否添加成功。
简单查询验证:
node_memory_MemFree_bytes
node_cpu_seconds_total
node_filesystem_avail_bytes
rate(node_cpu_seconds_total{mode="system"}[1m])
rate(node_network_receive_bytes_total[1m])
Alert Manger
Alert Manger 也可以通过 Docker 来安装使用:
docker run -d -p 9093:9093 \
    -v /path/to/alertmanager/config.yml:/etc/alertmanager/config.yml \
	--name alertmanager \
	prom/alertmanager
push gateway
Prometheus 默认的数据采集方式是通过 pull 模型,在配置中能看到 5 秒的配置,但是如果有些数据不适合使用这样的方式来监控,那么就需要使用 Push Gateway 将数据 Push 给 Prometheus 。
docker run -d -p 9091:9091 --name pushgateway prom/pushgateway
通过浏览器访问 9091 端口,Prometheus 提供了多个语言的 SDK 用来想 Push Gateway 发送数据,为了测试可以使用 shell 命令:
echo "cqh_metric 100" | curl --data-binary @- http://ip:9091/metrics/job/cqh
推送多个指标:
cat <<EOF | curl --data-binary @- http://ip:9091/metrics/job/cqh/instance/test
muscle_metric{label="gym"} 8800
bench_press 100
dead_lift 160
deep_squal 160
EOF
Grafana
通过 Docker compose 安装:
grafana:
  image: grafana/grafana
  volumes:
      - grafana_data:/var/lib/grafana
  environment:
    - GF_SECURITY_ADMIN_PASSWORD=pass
  depends_on:
    - prometheus
  ports:
    - '3000:3000'
Prometheus config
在安装好 Prometheus 会有 yaml 格式的配置文件。主要分为这几个部分:
global: 全局配置scrape_configs: 定义 Prometheus 需要 pull 的目标alerting: Alertmanager 配置rule_files: 告警规则
更多参数的解释可以参考官网.
alert rules
告警配置样例。
# Alert for any instance that is unreachable for >5 minutes.
ALERT InstanceDown   # alert 名字
  IF up == 0           # 判断条件
  FOR 5m             # 条件保持 5m 才会发出 alert
  LABELS { severity = "critical" }  # 设置 alert 的标签
  ANNOTATIONS {             # alert 的其他标签,但不用于标识 alert
    summary = "Instance  down",
	description = " of job  has been down for more than 5 minutes.",
  }
使用 Prometheus 监控 Flask 应用
我在最初寻找监控系统的时候就是为了给 Flask 应用使用。而 Prometheus 在各个方面都超出了我的预期,不过再回到原始的初衷。
Flask 中使用 Prometheus 需要引入 prometheus_client , Prometheus 的 Python 客户端。
import prometheus_client
from prometheus_client import Counter
from flask import Response, Flask, jsonify

app = Flask(__name__)

total_requests = Counter('request_count', 'Total webapp request count')

@app.route('/metrics')
def requests_count():
	total_requests.inc()
	return Response(prometheus_client.generate_latest(total_requests), mimetype='text/plain')

@app.route('/')
def index():
	total_requests.inc()
	return jsonify({
	    'status': 'ok'
	})

if __name__ == '__main__':
	app.run(host='0.0.0.0', port=5000)
修改 prometheus.yml 配置文件。
scrape_configs:
  - job_name: 'prometheus'
  static_configs:
    - targets: ['localhost:9090']
  - job_name: 'api_monitor'
  scrape_interval: 5s
  static_configs:
   - targets: ['web:5000']
PromQL
Prometheus 内置了数据查询语言 PromQL,它提供对时间序列数据丰富的查询,聚合以及逻辑运算的能力。同时也可以利用 PromQL 做告警和数据可视化。利用 Prometheus 可以轻易的回答这些问题:4
- 访问量前 10 的 HTTP 地址
topk(10, http_requests_total) - 计算 CPU 温度在两个小时内的差异
delta(cpu_temp_celsius{host="zeus"}[2h]) - 预测系统磁盘空间在 4 个小时之后的剩余情况
predict_linear(node_filesystem_free{job="node"}[1h], 4 * 3600) - 过去 5 分钟占用 CPU 最高的应用服务
PromQL 是 Prometheus 中非常重要的概念。最简单的使用方式就是输入指标名称,比如
up
指定 label 查询:
up{job="prometheus"}
或者使用 Instant vector selectors:
up{job!="prometheus"}
up{job=~"server|mysql"}
up{job=~"10\.10\.0\.1.+"}
=~ 正则匹配,使用 RE2 语法
选择一段时间内所有数据,Range vector selectors,比如查询 5 分钟内所有的 HTTP 请求数:
http_requests_total[5m]
Range vector selectors 返回的数据类型是 Range vector,一般需要和 rate() 或 irate() 函数一起使用。
# 计算的是每秒的平均值,适用于变化很慢的 counter
# per-second average rate of increase, for slow-moving counters
rate(http_requests_total[5m])

# 计算的是每秒瞬时增加速率,适用于变化很快的 counter
# per-second instant rate of increase, for volatile and fast-moving counters
irate(http_requests_total[5m])
PromQL 还支持 count, sum, min, max, avg, stddev(标准差),topk(前 k 条), quantile(分布统计), 等聚合操作,支持 rate, abs, ceil, floor 等内置函数,更多例子见官网.
和其他监控系统对比
Prometheus 值得注意的点
上面这么多文字可以看到 Prometheus 是一个很强大的监控系统,同时部署也非常方便,但 Prometheus 也并非 Silver Bullet,它并不能用来解决一切问题。可以注意到的是 Prometheus 非常适合微服务架构,利用服务发现可以轻松的将监控目标扩展到成千成万。
数据非 100% 可靠
Prometheus 采集的数据可能有丢失,不适用于对采集数据要求 100% 精确的场景。Prometheus 只针对可用性及性能进行监控,不具备日志监控等功能。
存储有限
Prometheus 只认为最近的监控数据有查询需求,Prometheus 在设计之初将数据保存在本地就并非为大量数据存储。如果需要对历史数据进行分析,可以使用 Prometheus 提供的远端存储 OpenTSDB, M3db 等等。
无权限系统
Prometheus 没有任何权限管理的功能,它只专注于做好一件事情,那就是监控及告警,Prometheus 认为权限管理应该属于上层管理系统去维护,所以 Prometheus 在设计时没有考虑任何权限管理问题。
reference
- https://github.com/prometheus/prometheus/
- https://www.ibm.com/developerworks/cn/cloud/library/cl-lo-prometheus-getting-started-and-practice/index.html
- https://youtu.be/PDxcEzu62jk
- https://www.aneasystone.com/archives/2018/11/prometheus-in-action.html
- https://www.infoq.cn/article/275NDkYNZRpcTIL2R8Ms
使用 asdf-vm 管理编程语言多个版本
之前浏览文章的时候偶然看到了 asdf 这个项目,然后惊讶的发现它整合了我之前经常使用的 pyenv 还有不太常用的 jenv, nvm, rvm,通过这一个命令就可以实现,所以立马在机器上试了一下。
Install
安装的过程具体可以参考官网,这里不多展开,Mac 下可以使用 Homebrew, 不过个人还是偏好使用 git clone 安装:
git clone https://github.com/asdf-vm/asdf.git ~/.asdf
然后在 ~/.zshrc 中添加:
. $HOME/.asdf/asdf.sh
Plugin
asdf 通过插件的形式可以添加不同语言的支持。支持的所用插件可以在这里 看到。
asdf plugin add python
安装具体版本:
asdf list all python
asdf install python latest
asdf install python 3.6.1
设置版本
asdf global python 3.6.1
asdf shell python 3.6.1
asdf local python 3.6.1
在 sudo 中使用 asdf
使用 asdf 安装的环境都在用户目录下, 如果要在 sudo 中使用,则会报错 sudo: xxx command not found,因为 sudo 默认不会将用户的环境变量传递过去。如果要在 sudo 中使用,则需要手动指定 PATH:
sudo -E env "PATH=$PATH" [command] [options]
可以设置一个 alias:
$ alias mysudo='sudo -E env "PATH=$PATH"'
reference
文章分类
最近文章
- AI Shell 让 AI 在命令行下提供 Shell 命令 AI Shell 是一款在命令行下的 AI 自动补全工具,当你想要实现一个功能,敲一大段命令又记不住的时候,使用自然语言让 AI 给你生成一个可执行的命令,然后确认之后执行。
- 最棒的 Navidrome 音乐客户端 Sonixd(Feishin) Sonixd 是一款跨平台的音乐播放器,可以使用 [[Subsonic API]],兼容 Jellyfin,[[Navidrome]],Airsonic,Airsonic-Advanced,Gonic,Astiga 等等服务端。 Sonixd 是一款跨平台的音乐播放器,可以使用 [[Subsonic API]],兼容 Jellyfin,[[Navidrome]],Airsonic,Airsonic-Advanced,Gonic,Astiga 等等服务端。
- 中心化加密货币交易所 Gate 注册以及认证 Gate.io 是一个中心化的加密货币交易所。Gate 中文通常被称为「芝麻开门」,Gate 创立于 2013 年,前身是比特儿,是一家致力于安全、稳定的数字货币交易所,支持超过 1600 种数字货币的交易,提供超过 2700 个交易对。
- 不重启的情况下重新加载 rTorrent 配置文件 因为我在 Screen 下使用 rTorrent,最近经常调试修改 rtorrent.rc 配置文件,所以想要找一个方法可以在不重启 rTorrent 的情况重新加载配置文件,网上调查了一下之后发现原来挺简单的。
- Go 语言编写的网络穿透工具 chisel chisel 是一个在 HTTP 协议上的 TCP/UDP 隧道,使用 Go 语言编写,10.9 K 星星。